
How to Look Up Solano County Jail Population Data
Solano does not run a single live population dashboard. Instead, the numbers live across four official or near-official sources. The Sheriff's department posts annual reports and links to custody data from its Sheriff public information page. The state collects quarterly jail head counts through the BSCC Jail Profile Survey, which feeds into the open-data set used by researchers. The federal Bureau of Justice Statistics publishes the national Annual Survey of Jails. The Vera Institute pulls those federal and state sources into one county trend page for Solano.
None of these sources update at the same speed. Sheriff annual reports are yearly. BSCC files are quarterly. BJS data lags a year or two. Vera trends end where federal data ends, so the most recent Vera year may be one or two years behind the live jail count. The 2022-2023 Civil Grand Jury assessment of the Sheriff's Custody Division is the most detailed local snapshot in print. The live in-custody search at the Sheriff's site shows current names, but it is a roster tool, not a population data tool.
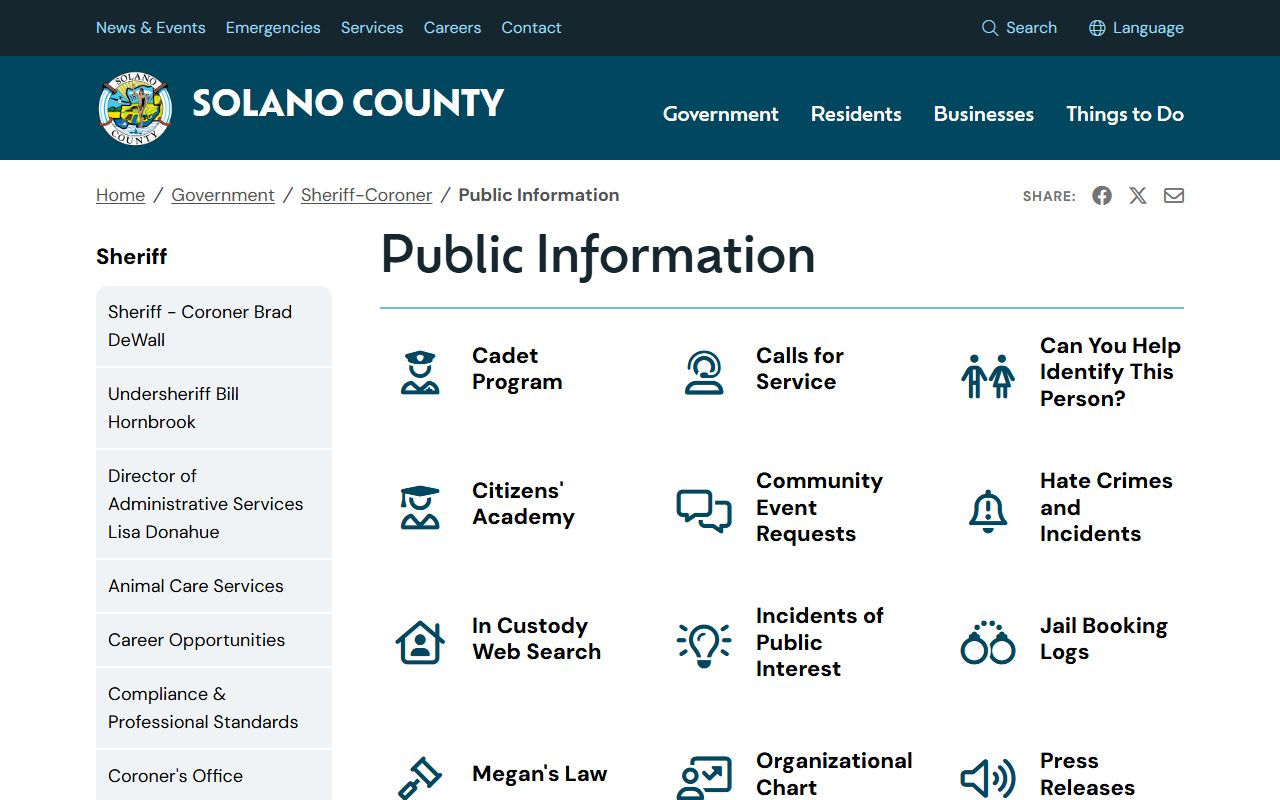
The image below shows the Sheriff's public information page that links to most of these custody tools.
Each figure on this page is tagged with its source. Numbers that come from the 2022-2023 Civil Grand Jury report are flagged as county-specific. Numbers that come from BJS are flagged as national. Vera trends sit in the middle and pull from both.
Solano County Jail Capacity Overview
Solano runs three custody facilities, all clustered in Fairfield. Together they hold a rated capacity of 1,435 beds. That total comes from the 2022-2023 Civil Grand Jury assessment of the Sheriff's Custody Division, which the court hosts as a public final sheriff report PDF. Rated capacity is the cap the state assigns based on cell count, square footage, and program space. It is not the same as a daily head count.
| Facility | Rated Capacity | Role |
|---|---|---|
| Justice Center Detention Facility | 712 | Main intake, booking, and pretrial holding. |
| Claybank Detention Facility | 358 | Sentenced and longer-term housing on Claybank Road. |
| Stanton Correctional Facility | 365 | Correctional housing on the Claybank Road campus. |
| Total rated beds | 1,435 | System-wide capacity, all three sites. |
Justice Center is the largest single site. It is where most people first arrive after arrest. Claybank and Stanton sit next to each other on Claybank Road, just outside the city core, and house sentenced inmates plus higher-classification populations. The rated total has not moved much in recent years. New jail construction in California needs state board approval and is rare.
Source note. Capacity figures above are county-specific. They come from the local Civil Grand Jury report linked above. They are not state or national figures.
Average Daily Population in Solano Jails
Average daily population, or ADP, is the mean head count over a given period. The 2022-2023 Civil Grand Jury report includes ADP figures for two of the three jails. Stanton showed an ADP of 265 in one period and 243 in the other. Claybank showed 123 and 97 in the same compared periods. Justice Center ADP was not broken out the same way in the extracted excerpt, but third-party summaries of the same report put the total system ADP near 525. That is well under the 1,435 rated cap.
| Facility | ADP Period A | ADP Period B | Source |
|---|---|---|---|
| Stanton Correctional Facility | 265 | 243 | 2022-2023 Civil Grand Jury |
| Claybank Detention Facility | 123 | 97 | 2022-2023 Civil Grand Jury |
| System total (approx.) | ~525 | ~525 | Civil Grand Jury, with third-party recitation |
ADP can drop for many reasons. Court delays, bail reform rulings, emergency early-release orders, and a slow flow of new bookings all shift the count. ADP can also rise. A big patrol push, a backlog after a long court closure, or new state laws that route more people to county jail can push numbers up fast. Anyone tracking Solano ADP over time should pull the latest BSCC Jail Profile Survey before drawing trend lines from older numbers.
Source note. These ADP figures are county-specific and tied to one report. They are not live counts. For a current snapshot, the build path is Sheriff annual reports or the BSCC quarterly survey.
Pretrial vs Sentenced Population
Every county jail in California holds two main groups. The first group is pretrial. These people have been arrested and charged but have not been convicted. They are in jail because bail was set too high, no bail was allowed under the law, a judge held them, or they could not post a bond. The second group is sentenced. These people have already pled guilty or been convicted and are now serving time in county custody.
Before AB 109, also called Public Safety Realignment, most sentenced felons went to state prison under the California Department of Corrections and Rehabilitation. AB 109 shifted custody of many lower-level felons to county jail. That law took effect in 2011. Since then, Solano and every other county jail holds a wider mix of sentenced people. Some serve months. Some serve multi-year terms that used to go to state prison.
The pretrial share of any California county jail tends to run high. Statewide, pretrial detainees make up the majority of jail beds. The exact Solano pretrial-to-sentenced split changes by week and is best pulled from the latest Sheriff or BSCC report. For trend context, the Vera Institute's Solano County incarceration trends page graphs pretrial counts going back decades.
Misdemeanor vs Felony Population
The other big split is misdemeanor versus felony. Misdemeanor inmates carry charges that cap out at one year in county jail. Felony inmates carry charges that can lead to longer county time under AB 109 or, in older or more serious cases, transfer to state prison.
In Solano, the felony share has been driven up by AB 109 since 2011. Many felons who used to go to CDCR now serve their full term in the Claybank or Stanton facilities. Misdemeanor counts tend to be smaller. Many misdemeanor defendants are cited and released at the scene, bail out quickly, or get sentenced to time already served. The chronic in-custody group skews felony.
Exact percentages by charge class are not pushed out by the Sheriff in real time. The BSCC Jail Profile Survey breaks counts by status and offense level. Solano County annual reports may include a chart of bookings by charge type. For research-grade comparison, the Vera page tracks long-term felony share by county.
Demographic Breakdown
Demographic detail on Solano's jail population is best pulled from the Vera Institute county page. Vera reports county jail counts by race, sex, and pretrial status across decades. The Vera page for Solano sits at the link below and pulls from federal data sources.
The image below is the Vera Institute county trends page for Solano.
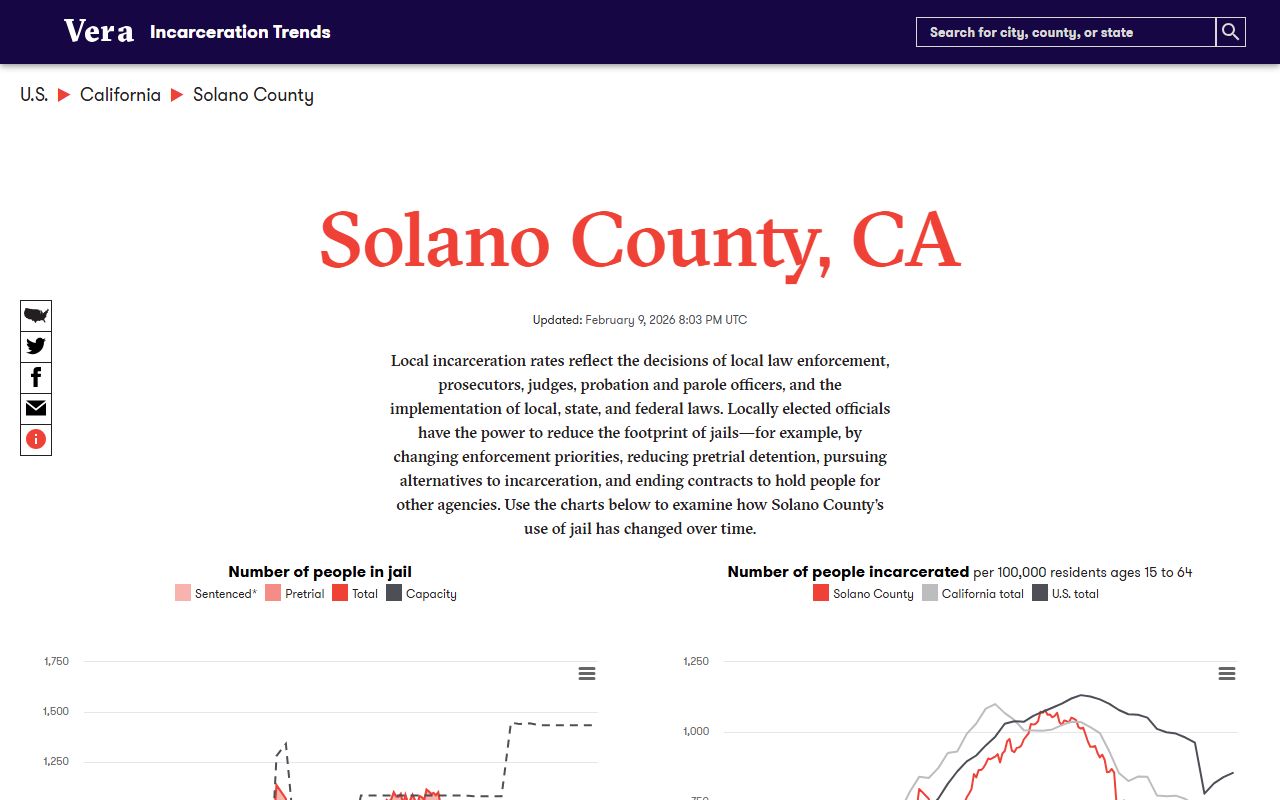
Vera shows that Solano, like most California counties, holds more men than women, though the female jail count has grown faster over the past two decades than the male count. Vera also tracks racial breakdowns and admission rates, which are the share of county residents booked into jail each year. For the latest Solano Vera figures, see the Vera Solano County trends page.
The Sheriff's office does not post a public race-and-sex breakdown of the live roster. Researchers who need that detail should pull the BSCC files directly or request a Public Records Act response from the Sheriff under California Government Code 7920 and 7923.
Mental Health and Medical Population
A share of every county jail population needs medical care, mental health care, or both. Solano's local rules and Penal Code rules require classification screening at intake. The screening catches medical needs, mental health holds, suicide risk, and people who may need an LPS (Lanterman-Petris-Short) conservatorship referral for mental health treatment.
The Sheriff does not publish a daily count of inmates on the medical or mental health unit. The Civil Grand Jury report touches on classification and medical housing, but it does not give a clean percent. For broader context, BJS data show that a large share of jail inmates nationwide report some form of mental illness or chronic medical condition. Solano's actual count is held in Sheriff custody records and the contracted medical provider's logs. Those records are not public.
People who need to find a jailed family member with a known medical or mental health condition should call the 24-hour booking line at (707) 784-7112. The Records and Warrants Bureau can sometimes confirm a housing unit if the inmate has signed a release.
National and State Context
To put Solano numbers in context, the standard yardstick is jail population per 100,000 residents. The federal Bureau of Justice Statistics is the official source for the national figure. The most recent BJS Annual Survey of Jails puts the national jail incarceration rate near 140 per 100,000 residents. California's statewide jail rate tends to run a bit below the national average. Solano's own rate has not been published in a clean per-capita form by the Sheriff, so the figure below is flagged for direct verification.
| Level | Jail Population per 100k | Source |
|---|---|---|
| National (United States) | ~140 | BJS Annual Survey of Jails |
| California (state) | Slightly below national; verify | BSCC Jail Profile Survey |
| Solano County | Verify with Sheriff / BSCC | Pull from current Sheriff annual report or BSCC |
The BJS page is the best place to start for the national rate. It sits at the Bureau of Justice Statistics home. The state figure should be pulled fresh from BSCC each time the page is updated, since California rates have moved a lot since 2011 realignment, 2014 Prop 47, and 2020 court closures.
Source flag. The Solano per-capita line is not a published official figure. Anyone citing it should pull the Sheriff's most recent annual report or file a BSCC data request. Treat the national and state lines as estimates, not exact current values.
Population Trends Over Time
Long-term jail population trends in Solano follow the broader California pattern. Counts rose through the 1990s and 2000s, then shifted sharply after three big events. Realignment under AB 109 in 2011 pushed more felons into county jail. Prop 47 in 2014 reclassified some drug and theft felonies to misdemeanors and trimmed counts. COVID-19 in 2020 caused court closures, emergency releases, and a steep short-term drop in jail population statewide.
The Vera Institute Solano page graphs these shifts year by year. It shows total jail population, pretrial population, and admission counts. The Vera data ends where federal data ends, so the most recent Vera year may be one or two years older than the live jail count. Vera also covers women's jail population separately, which is useful given how fast that count has grown.
For trend work past the Vera cutoff, the best move is to read the latest Solano County annual reports. The county posts those at the Solano County annual reports page. Sheriff sections in those reports sometimes include yearly booking totals and ADP. The Civil Grand Jury also runs custody reviews on rotation, and each new report gives a fresh snapshot.
Searching for Solano County Inmate Records by Name
This page covers aggregate jail population data. It does not cover live roster lookups. To search by name for a person held right now in a Solano jail, use the live tool described on the Solano County inmate records page. That page also covers the Sheriff's seven-day booking log and the 24-hour booking phone line. For people who were in custody but have since been released, see the released inmates page.
Where the Data Comes From
The Solano jail population numbers on this page come from a short list of named sources. Each one has a different update cadence and a different scope.
- BSCC Jail Profile Survey: quarterly head counts and classification data for every California county jail.
- Solano County annual reports: yearly summaries that can include Sheriff custody and budget detail.
- 2022-2023 Civil Grand Jury Sheriff's Custody Division report: capacity table and ADP figures by facility.
- Vera Institute Solano County trends: multi-decade trend graphs for county jail population.
- Bureau of Justice Statistics national jail data: official federal source for the national rate per 100,000.
- Sheriff main department page and public information page: live custody tools and press releases.
For people who need population data tied to a specific court case, the path is different. Start with the Superior Court or the court records page to pull case-level files. Criminal arrest counts that feed into jail bookings are covered on the criminal records page. Solano's jail population data is the back end of those criminal court flows, not a stand-alone count.